How to Graph on the TI-84 Online Calculator — Your Step-by-Step Guide 2025
Graphing is one of the most powerful and widely used features of the TI-84 calculator. Whether you’re solving equations, analyzing functions, or visualizing trends, mastering the graphing tool can make complex math easier and more intuitive. The best part? When you use the TI-84 online calculator at ti-84-calculator.net, the process becomes even simpler and free from physical buttons; its a no wear and tear, just clean clicks and fast results to get graphing done.
Let us walk you through exactly on how to graph like an expert on your TI-84 calculator online.
When Should You Use the Graphing Feature?
Graphing helps when you want to:
- Visualize algebraic functions (e.g., y = x², y = sin(x), etc).
- Understand how changes in an equation affect its curve.
- Identify key features like intercepts, asymptotes, max/min values, and points of intersection.
- Double-check your answers during tests, quizzes, or assignments.
Using the graphing feature online makes this process faster, more interactive, and less intimidating, perfect for students, teachers, and anyone who is trying to brush up on their math skills.
Step-by-Step: How to Graph Using the Online TI-84 Calculator
Follow these easy steps to start graphing with confidence:
1. Launch the Online Calculator
Visit ti-84-calculator.net. The calculator will load instantly in your browser—no download, no sign-up required.
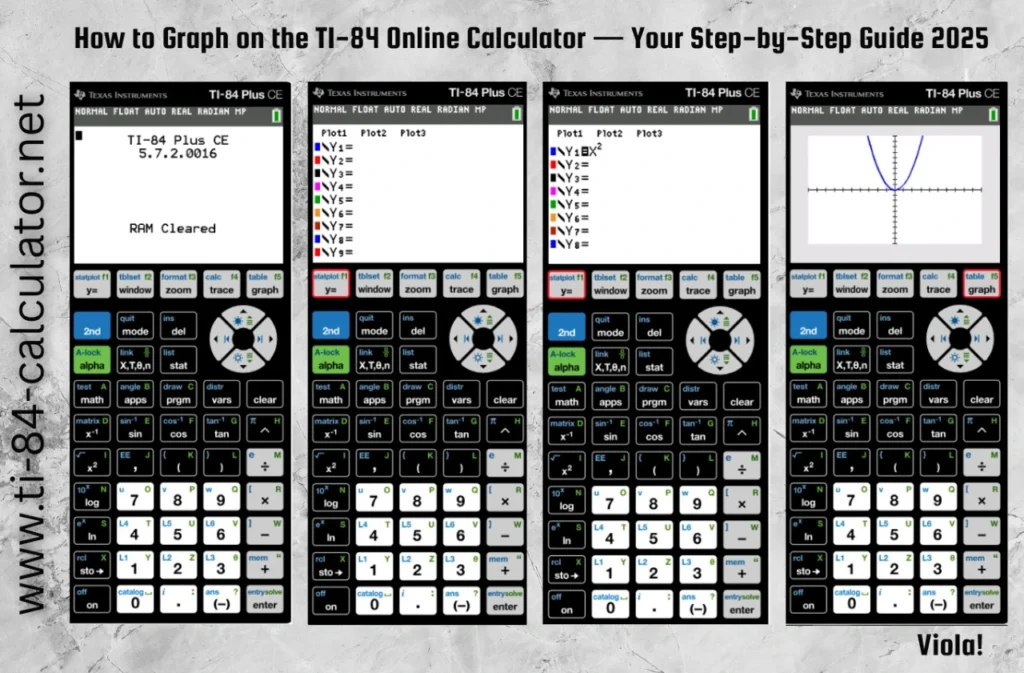
2. Press the Y= Button
Just like on the physical TI-84, the online version includes a Y= button, located near the top-left corner of the calculator interface. Click it to open the function editor where you can input your equations.
3. Enter Your Equation
You’ll see input fields like Y1=, Y2=, etc. Click next to Y1= and type your function. For example:
x^2 for a basic parabola
2x + 3 for a linear equation
sin(x) for a trigonometric function
You can graph multiple equations at once by entering them into Y2=, Y3=, and so on.
4. Press the GRAPH Button
Once your equation(s) are entered, click the GRAPH button—usually found in the upper-right portion of the interface. The graph will appear in the display window, giving you a visual representation of your function.
5. Adjust the View with WINDOW
Want to zoom in or out? Need to change the x or y values being shown? Click the WINDOW button and adjust the settings:
Xmin, Xmax control the horizontal viewing range
Ymin, Ymax control the vertical viewing range
Tweak these numbers to fit your function on-screen perfectly
6. Use TRACE to Explore the Graph
After the graph appears, click TRACE to move along the curve. This allows you to see the exact x and y coordinates at any point, helping you identify intercepts, turning points, and more.
Need to Start Over? Just Reset
If the graph becomes messy or you want a clean slate to begin with again, use the Reset feature in the calculator’s menu (see our full guide on how to reset your TI-84 calculator online).
Pro Tips for Graphing Online
Use ZOOM → ZoomFit for an automatic window adjustment that fits your graph nicely.
Use 2nd + CALC to access tools like finding max, min, intercepts, and intersection points.
Save time by copying your equations before refreshing or switching windows.
Final Thoughts
Graphing with the TI-84 calculator online brings clarity to equations and functions that can otherwise seem abstract or confusing. Whether you’re solving for x, comparing slopes, or preparing for your next math exam, this powerful feature makes it all visual—and much easier to understand. Ready to try it now? Head over to our ti-84-calculator.net homepage and try to graph your first function today. It’s simple, sleek, and absolutely stress-free.